
Aircraft drawings use several methods to represent objects, components, and systems. These methods help engineers, draftsmen, mechanics, and inspectors understand the construction, arrangement, and operation of aircraft components. The most common methods include applied geometry, orthographic projection drawings, pictorial drawings, diagrams, and flowcharts.
Table of Contents
Table of Contents
Applied Geometry
Geometry is the branch of mathematics that deals with lines, angles, figures, and their properties in space. Applied geometry uses these properties to represent objects accurately and correctly in drawings.
In the past, draftsmen used a variety of instruments with different scales, shapes, and curves to prepare drawings. Today, computer graphics programs can produce drawings at a wide range of scales and represent many shapes and curves, reducing the need for some traditional drawing instruments.
Several methods are used to illustrate objects graphically. The most common are orthographic projections, pictorial drawings, diagrams, and flowcharts.
Orthographic Projection Drawings
To show the exact size and shape of all the parts of a complex object, several views may be necessary. This is the system used in orthographic projection.
In orthographic projection, an object can be represented by six possible views: front, top, bottom, rear, right side, and left side. Figure 1A shows an object placed inside a transparent box hinged at its edges. The projections on the sides of the box represent the views seen when looking straight at the object through each side.

If the outlines of the object are drawn on each surface of the box and the box is opened to lie flat, as shown in Figures 1B and 1C, the result is a six-view orthographic projection.
It is seldom necessary to show all six views to portray an object clearly. Only the views needed to illustrate the required characteristics are included. One-, two-, and three-view drawings are the most common.
Regardless of the number of views used, the arrangement generally follows the convention shown in Figure 1, with the front view as the principal view. If the right-side view is included, it is placed to the right of the front view. The left-side view is placed to the left. The top and bottom views, when included, are placed in their respective positions relative to the front view.
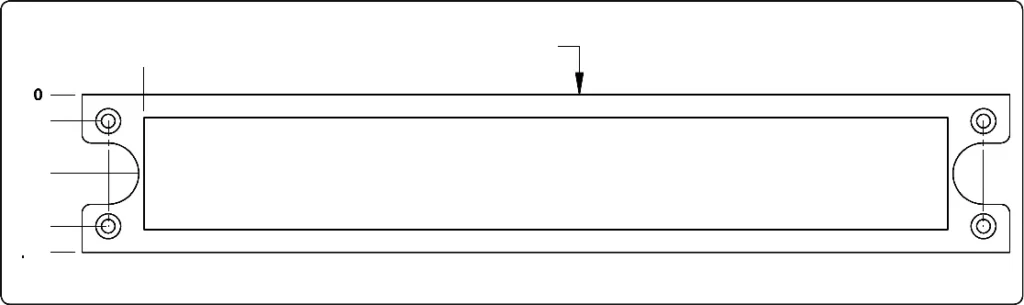
One-view drawings are commonly used for objects of uniform thickness, such as gaskets, shims, and plates. A dimensional note specifies the thickness, as shown in Figure 2.
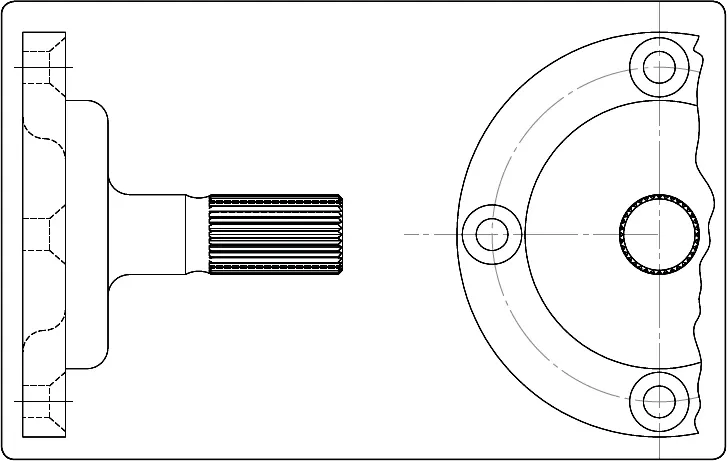
One-view drawings may also be used for cylindrical, spherical, or square parts when all necessary dimensions can be shown clearly in a single view. When space is limited and two views are required, symmetrical objects may be represented by half views, as illustrated in Figure 3.
Aircraft drawings seldom show more than two principal or complete views of an object. Instead, they usually include one complete view and one or more detail or sectional views.
Detail View
A detail view shows only a portion of an object, but in greater detail and at a larger scale than the principal view. The portion shown separately is usually enclosed by a heavy line on the principal view, as illustrated in Figure 4.

The principal view shows the complete object, while the detail view provides an enlarged representation of the selected portion.
Pictorial Drawings
A pictorial drawing resembles a photograph in that it shows an object as it might appear to the eye. However, it is not always suitable for representing complex forms and shapes. [Figure 5]

Pictorial drawings are useful for showing the general appearance of an object and are often used together with orthographic projection drawings. They are used extensively in Aircraft Maintenance Manuals (AMM), Structural Repair Manuals (SRM), and Illustrated Parts Catalogues (IPC).
Four types of pictorial drawings frequently used by aircraft engineers and technicians are perspective, isometric, oblique, and exploded-view drawings.
Perspective Drawings
A perspective view shows an object as it appears to an observer, as illustrated in Figure 6A. It most closely resembles the way an object appears in a photograph.

Because of perspective, some lines that are parallel in the actual object appear to converge in the drawing. Therefore, actual angles and dimensions are not represented accurately in a perspective view.
Isometric Drawings
An isometric view provides a three-dimensional representation of an object, as shown in Figure 6B. It allows portions of the object’s three principal dimensions to be seen in a single view.
Unlike a perspective drawing, the parallel lines in an isometric drawing remain parallel. Dimensions can be represented along the isometric axes, although the drawing’s appearance differs from a true orthographic view.
Oblique Drawings
An oblique view is similar to an isometric view, but with a distinct difference. In an oblique drawing, the front face of the object is represented in its true shape, with two axes at right angles to each other. The third axis is drawn at an angle to show depth, as illustrated in Figure 6C.
Exploded View Drawings
An exploded-view drawing is a pictorial representation of two or more parts that fit together as an assembly. It shows the individual parts and their relative positions before they are assembled, as illustrated in Figure 7.
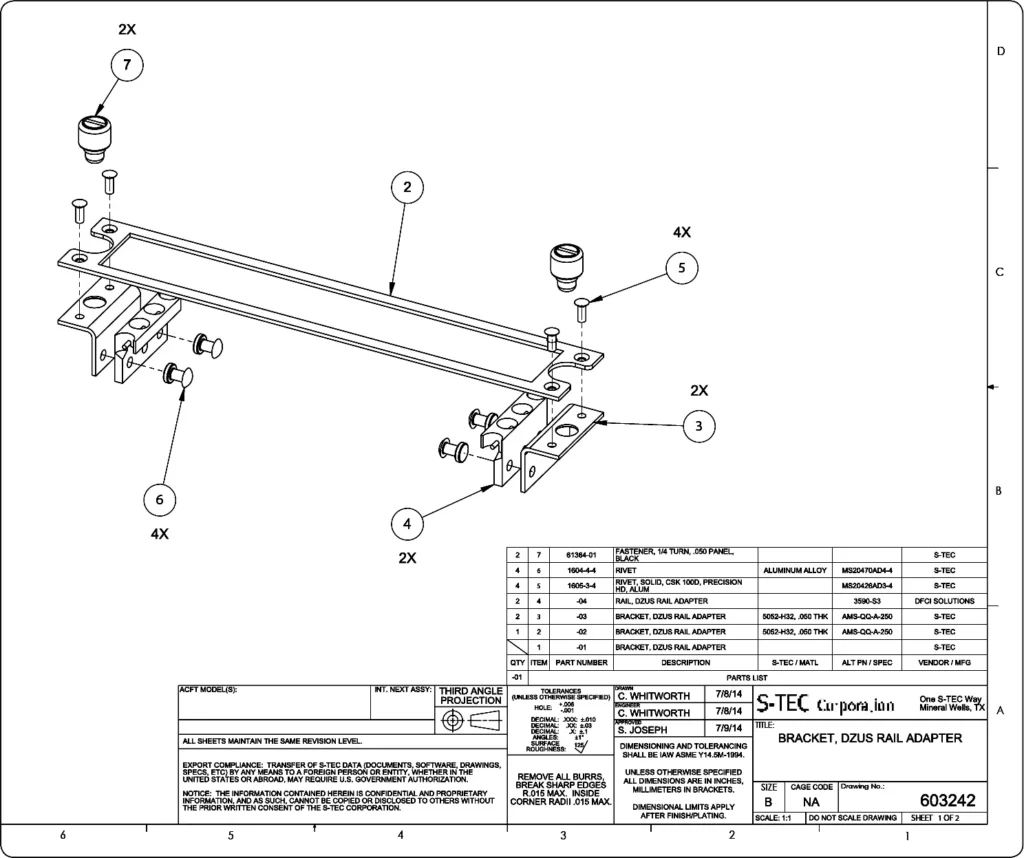
Exploded-view drawings are often used in Illustrated Parts Catalogues (IPC) for identifying and ordering parts. The drawing uses item numbers that correspond to a list of part numbers.
Exploded views are also used in Maintenance Instruction Manuals (MIM) for the assembly and repair of aircraft components. These drawings may be accompanied by notes explaining the assembly process.
Diagrams
A diagram is a graphic representation of an assembly or system. It identifies the various parts and illustrates the methods or principles of operation.
The diagrams most commonly used by aviation mechanics may be grouped into four types: installation diagrams, schematic diagrams, block diagrams, and wiring diagrams.
Installation Diagrams
Figure 8 is an example of an installation diagram.

The figure illustrates the installation of an aircraft’s flight guidance control components. It identifies the components in the system and shows their locations in the aircraft. Each number on the drawing identifies the location of an individual flight guidance system component within the flight deck.
Installation diagrams are used extensively in aircraft maintenance and repair manuals. They are valuable for identifying and locating components and for understanding the arrangement of various aircraft systems.
Schematic Diagrams
Schematic diagrams do not show the actual location, size, or shape of individual aircraft components. Instead, they show the components in relation to one another within a system.
Schematics illustrate the operating principles of an aircraft system and are often used for troubleshooting and training.
Figure 9 illustrates a schematic diagram of an aircraft air-conditioning system. High-speed bleed air from the engine is combined with cold air in a mixing chamber and distributed through a manifold to various parts of the aircraft.

The lines in a schematic are coded to make the system easier to read and trace. Each component is identified by name, and its relationship to other components can be determined by following the lines leading into and out of it.
Schematic and installation diagrams are used extensively in aircraft manuals.
Block Diagrams
Block diagrams show simplified relationships within a complex system of components, as illustrated in Figure 10.

Individual components are represented by rectangles, or blocks, with lines connecting them to other components with which they interface during operation.
Wiring Diagrams
Wiring diagrams show the electrical wiring and circuitry of aircraft electrical appliances and devices. The wiring and components are coded for identification, as illustrated in Figure 11.

Even wiring diagrams for relatively simple circuits can be complicated. Technicians involved in electrical repairs and installations need a thorough understanding of wiring diagrams and electrical schematics.
Flowcharts
Flowcharts illustrate a sequence or flow of events. Two types of flowcharts frequently used in the aviation industry are troubleshooting flowcharts and logic flowcharts.
Troubleshooting Flowchart
Troubleshooting flowcharts are frequently used to help detect faulty components. They often consist of a series of yes-or-no questions.
If the answer to a question is yes, one course of action is followed. If the answer is no, a different course of action is followed. This process provides a logical way to investigate a problem and determine an appropriate solution.
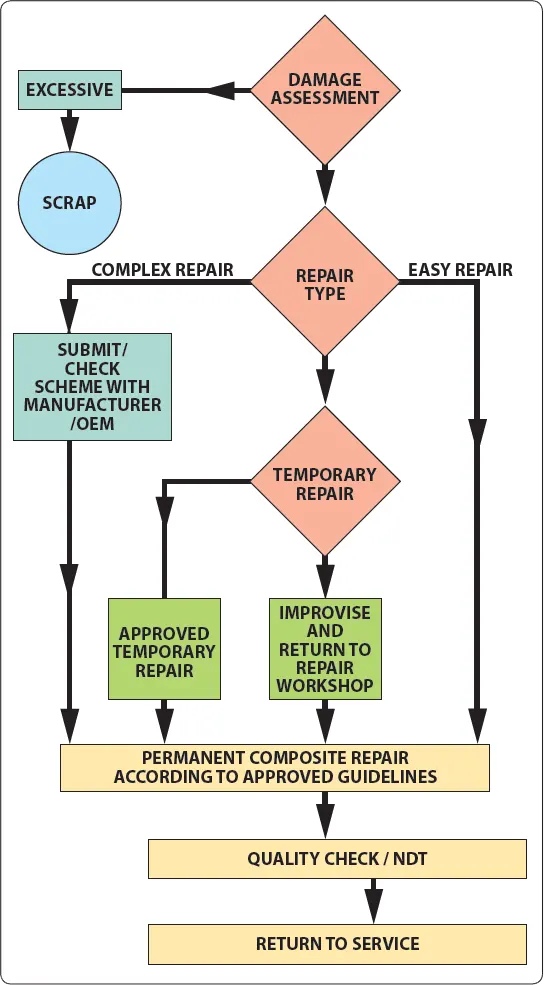
Figure 12 shows a flowchart used to determine repair options for a composite structure.
Logic Flowchart
A logic flowchart is used specifically for analyzing digitally controlled components and systems, as illustrated in Figure 13.
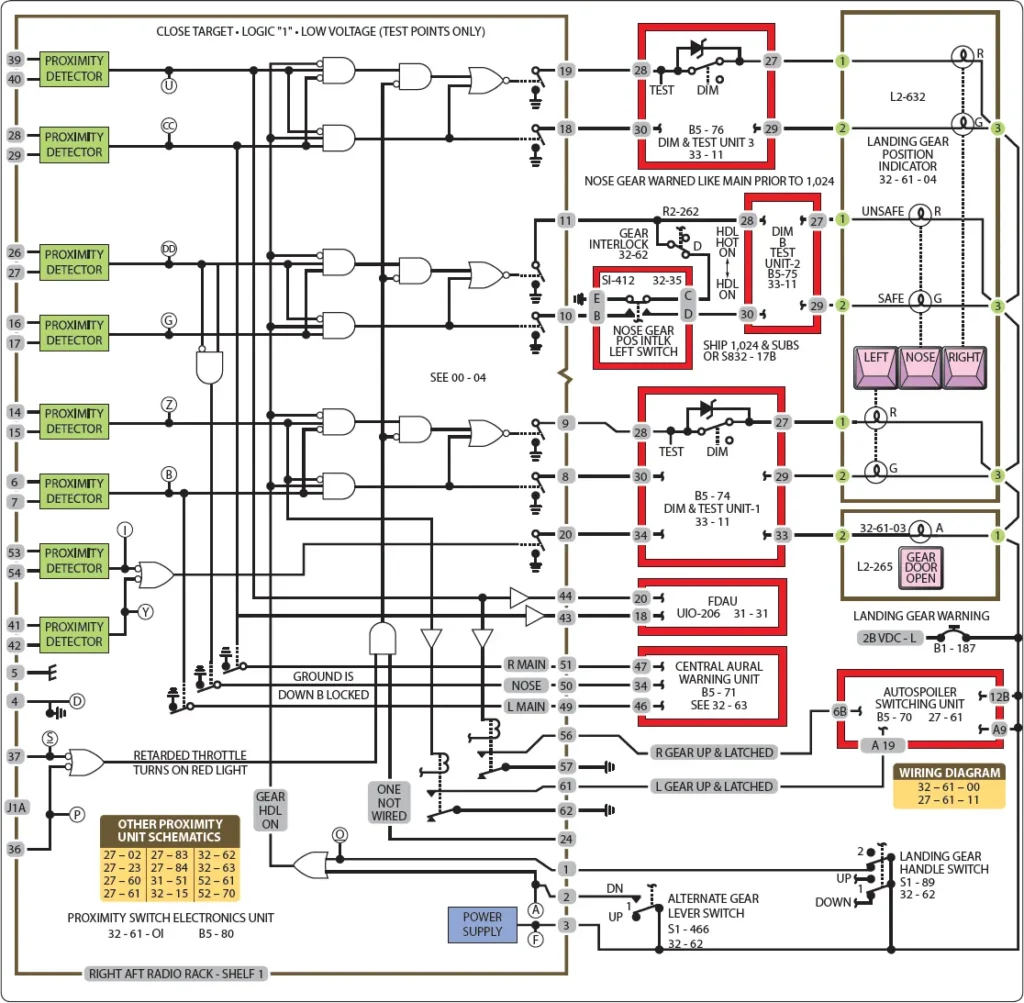
Logic flowcharts use standardized symbols to represent specific types of logic gates and their relationships with other digital devices.
Digital systems use binary values, such as 1s and 0s, to represent conditions including voltage or no voltage, or a light pulse or no light pulse. Logic flowcharts represent components that receive inputs and produce outputs. By analyzing one or more inputs, the resulting digital output or outputs can be determined.