
Graphs and charts are pictorial representations of data. They enable technicians to visualize relationships, perform complex calculations, and predict trends. Charts also help show the rate and magnitude of changes in a system or set of values. In aircraft maintenance, charts and graphs are used to interpret technical data and determine whether operating conditions and performance are within acceptable limits.
Information can be presented graphically in many different forms. Common types of graphs include bar graphs, pictographs, broken-line graphs, continuous-curve graphs, and circular graphs or pie charts. [Figure 1]
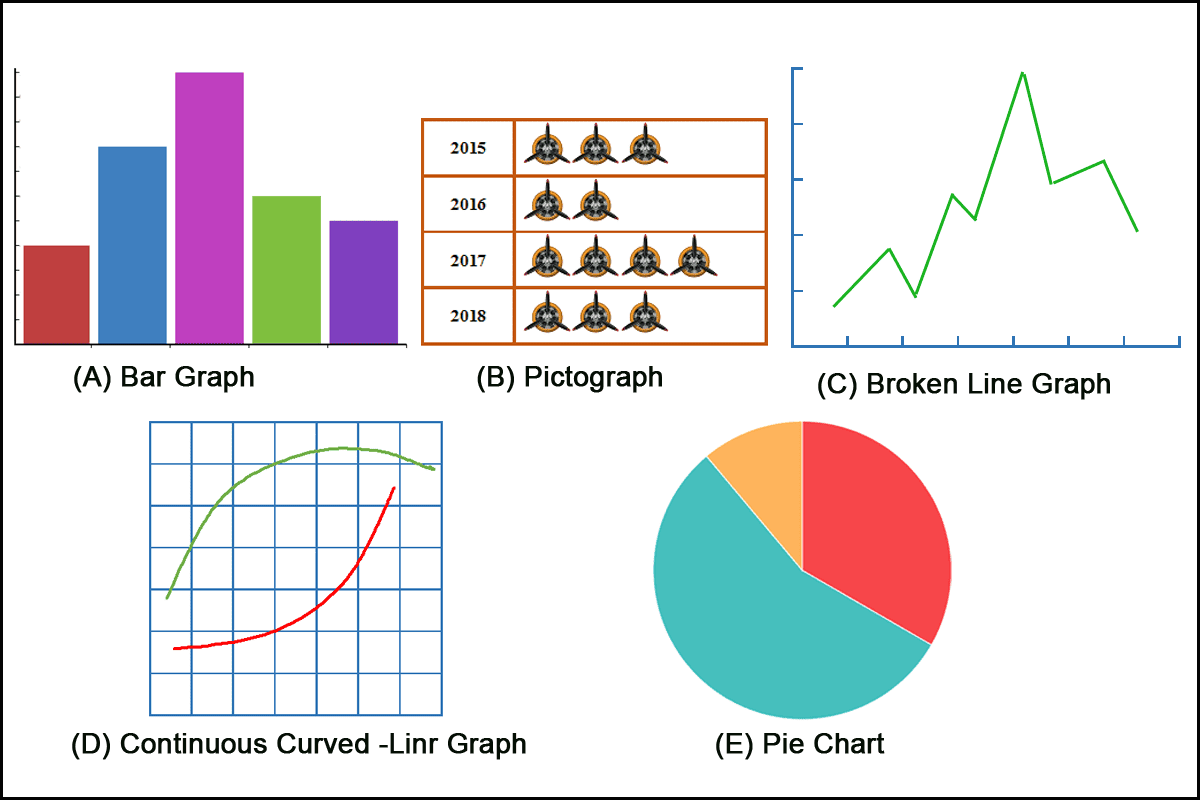
Bar graphs, pictographs, broken-line graphs, continuous-curve graphs, and pie charts are all methods of graphically representing data and calculation results.
Nomograms
The need to show how two or more variables affect a value is common in the maintenance industry. Nomograms are a special type of graph that enable technicians to solve complex problems involving more than one variable.
Most nomograms contain a great deal of information and require the use of scales on three sides of the chart, as well as diagonal lines. Some charts contain so much information that it is important to carefully read the instructions before using them. Other charts, however, are simple to use.
Electric Wire Chart
An example of a nomogram chart used extensively in the maintenance industry is the electric wire chart. This chart consists of vertical lines representing American Wire Gauge (AWG) wire sizes. Horizontal lines represent the length of wire, in feet, that produces an allowable voltage drop for each electrical system listed. A series of parallel diagonal lines represents current flow.
A common use for this chart is to determine the wire size required to carry a given amount of current without exceeding the allowable voltage drop.
For example, determine the minimum wire size for a single cable in a bundle carrying 125 amperes over a distance of 25 feet in a 28-volt system. [Figure 2]
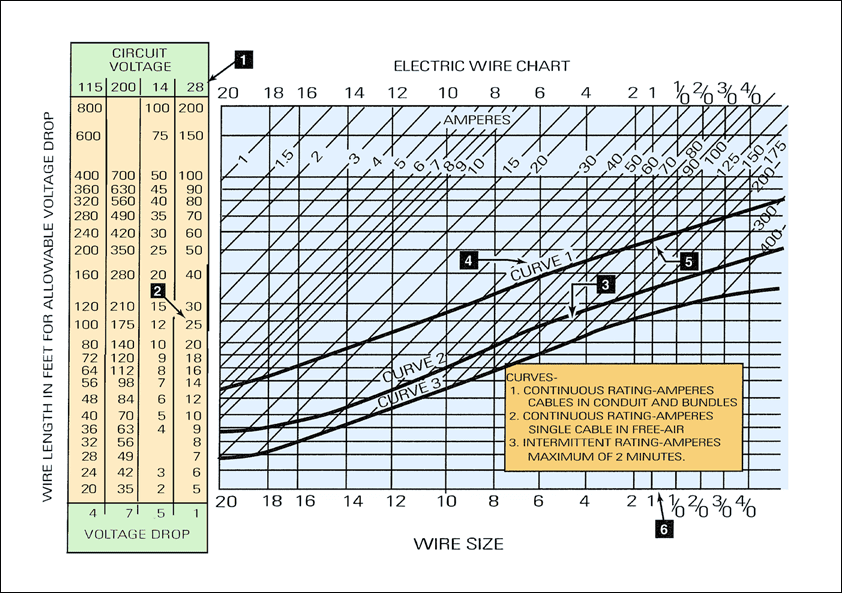
To begin, locate the column on the left side of the chart representing a 28-volt system (item 1). Move down this column until you find the horizontal line representing a wire length of 25 feet (item 2). Follow this line to the right until it intersects the diagonal line representing 125 amperes (item 3).
Because the wire is in a bundle and carries a continuous current, the selection must be at or above curve 1 on the chart (item 4). Follow the diagonal line representing 125 amperes until it intersects curve 1 (item 5). From this point, drop vertically to the bottom of the chart. The line falls between wire sizes 1 and 1/0 (item 6). Whenever the chart indicates a wire size between two sizes, select the larger wire. In this case, a 1/0, or single-aught, wire is required.
Notice that the three curves extend diagonally across the chart from the lower-left corner to the right side. These curves represent the ability of a wire to carry current without overheating. Curve 1 represents the continuous rating of a wire when routed in bundles or conduit. If the intersection of the current and wire-length lines is above this curve, the wire can carry the current without generating excessive heat.
If the intersection falls between curves 1 and 2, the wire can be used to carry current continuously in free air. If the intersection falls between curves 2 and 3, the wire can only be used to carry current intermittently.
Brake-Horsepower Charts
Another common type of graph encountered by aircraft technicians is the performance chart. One example is the brake-horsepower chart. These charts represent many hours of engineering calculations, but they are presented so technicians can quickly determine whether observed performance is acceptable.
For this sample chart, assume an engine has a displacement of 2,000 cubic inches and develops 1,500 brake horsepower at 2,400 rpm. [Figure 3]

To calculate the brake mean effective pressure (BMEP), begin by locating 1,500 brake horsepower at the top of the chart. From this value, drop vertically until you reach the line representing 2,000 cubic inches of displacement. From this intersection, extend a line horizontally to the right until it intersects the line representing 2,400 rpm. Then drop vertically to read the brake mean effective pressure on the bottom line of the chart. The brake mean effective pressure is approximately 248.
Fuel Consumption Charts
The fuel consumption chart is another type of performance chart with which technicians must be familiar. For this sample chart, assume you are trying to determine how much fuel an engine consumes when operating at a cruise speed of 2,400 rpm. [Figure 4]
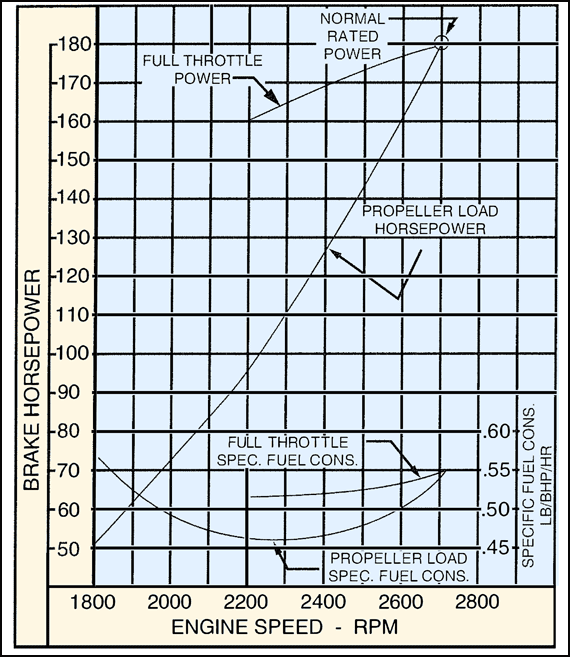
To determine fuel consumption for an engine operating at 2,400 rpm, first determine the specific fuel consumption. Locate 2,400 rpm on the bottom of the chart and follow the line upward until it intersects the propeller-load specific fuel consumption curve. From this intersection, extend a line to the right side of the chart and read a specific fuel consumption of 0.47 lb/bhp/hr.
Next, return to the bottom of the chart and locate 2,400 rpm again. From this point, move upward to the propeller-load horsepower curve. From this intersection, extend a line to the left side of the chart and read a brake horsepower of 127 hp.
To determine the fuel burn, multiply the specific fuel consumption by the brake horsepower:
0.47 × 127 = 59.69 pounds per hour.
Therefore, the engine burns approximately 59.69 pounds of fuel per hour.
Engine Horsepower/Altitude
This chart represents the relationship between engine horsepower and altitude. For this sample chart, assume you are performing an engine run-up at an altitude of 7,000 feet. [Figure 5]

To determine the percentage of sea-level horsepower developed at an altitude of 7,000 feet, begin by finding the point on the horizontal axis that represents the desired altitude. From this point, move upward until you intersect the horsepower curve. Then move horizontally to the left, toward the chart’s vertical axis, and read the percentage of sea-level horsepower available.
There are many other ways of presenting information with graphs. Pie or circular charts can show the percentage of an item in relation to the whole. Graphs can also show the relationship between two or more variables.